

2025

2024

2023

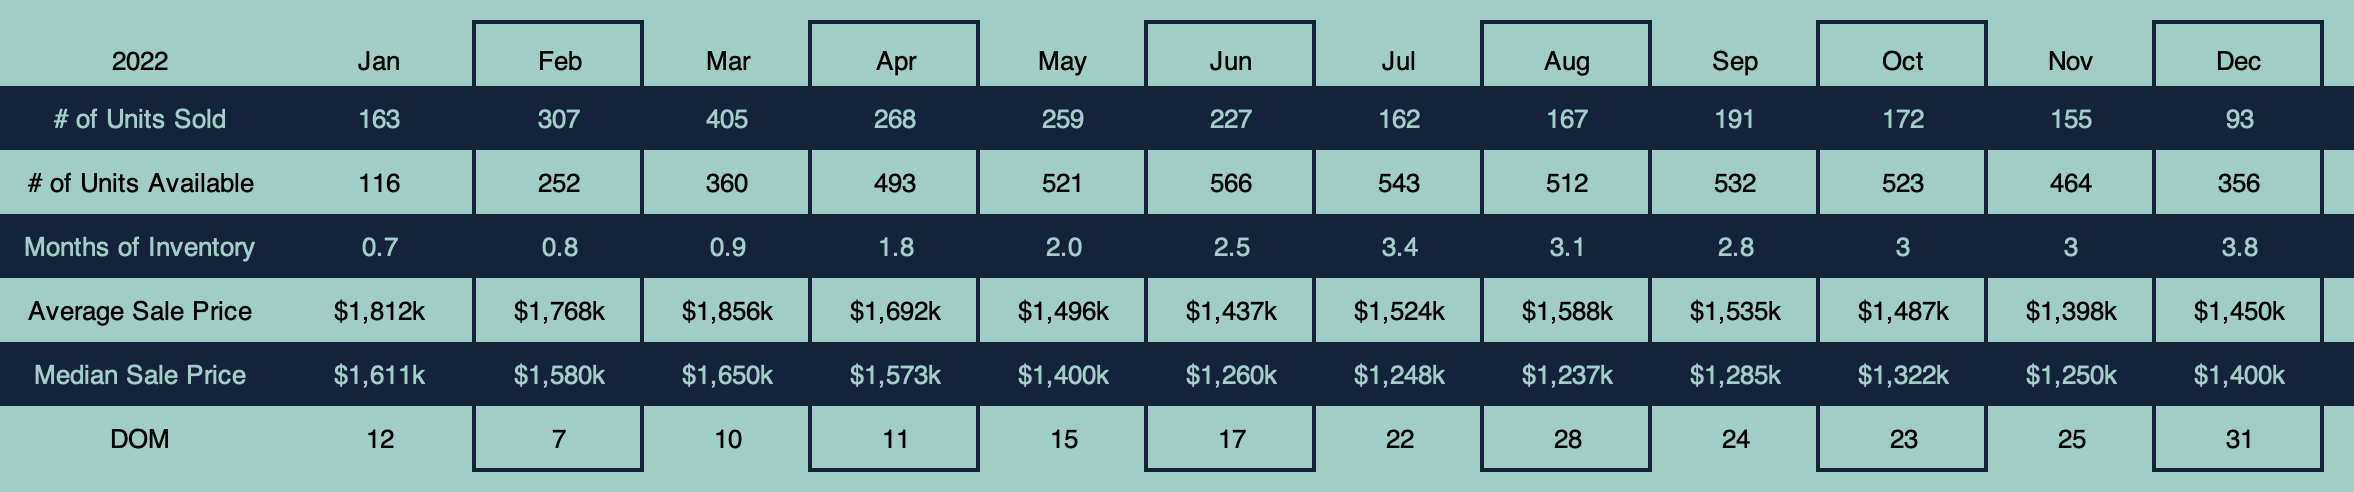
2022
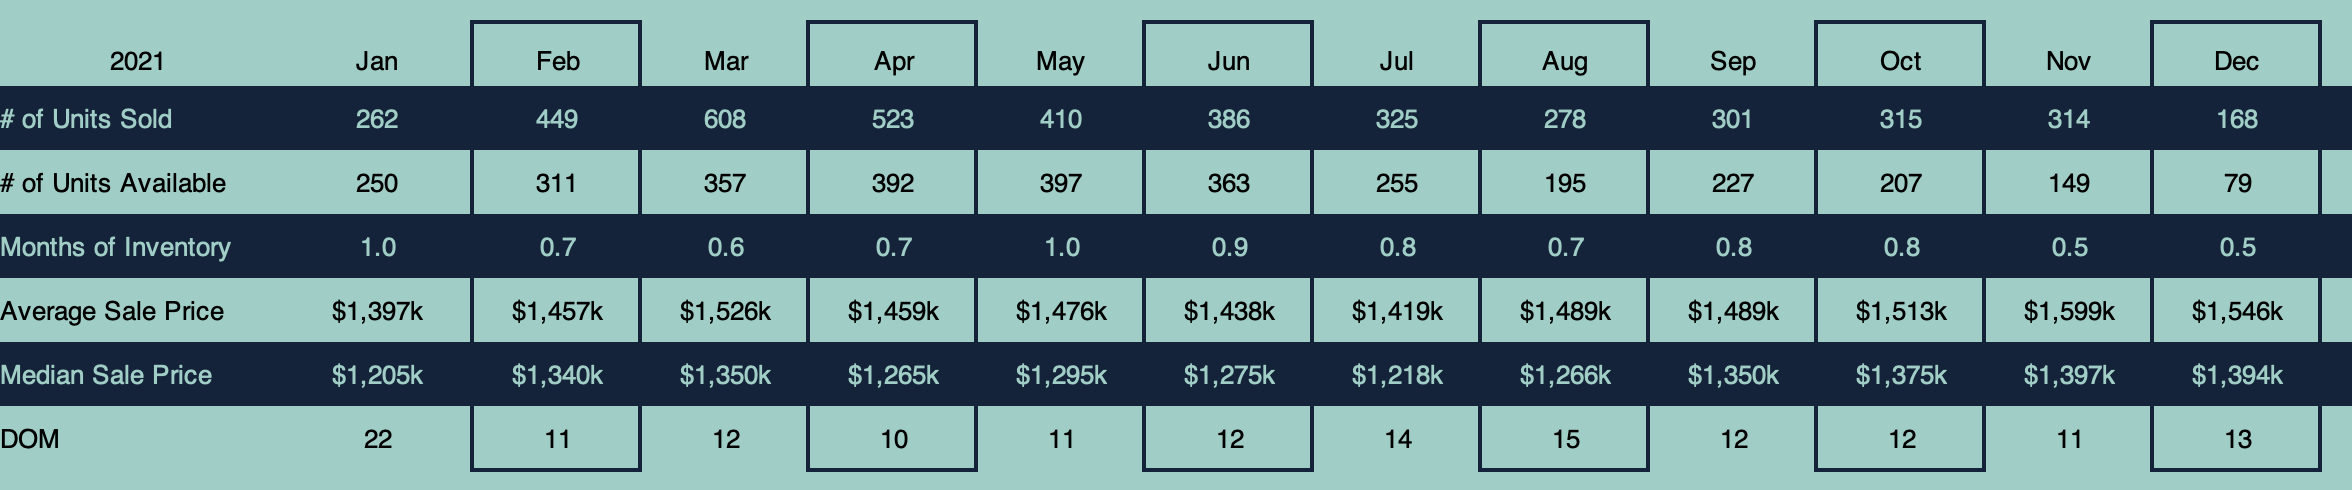
2021
2020

2019

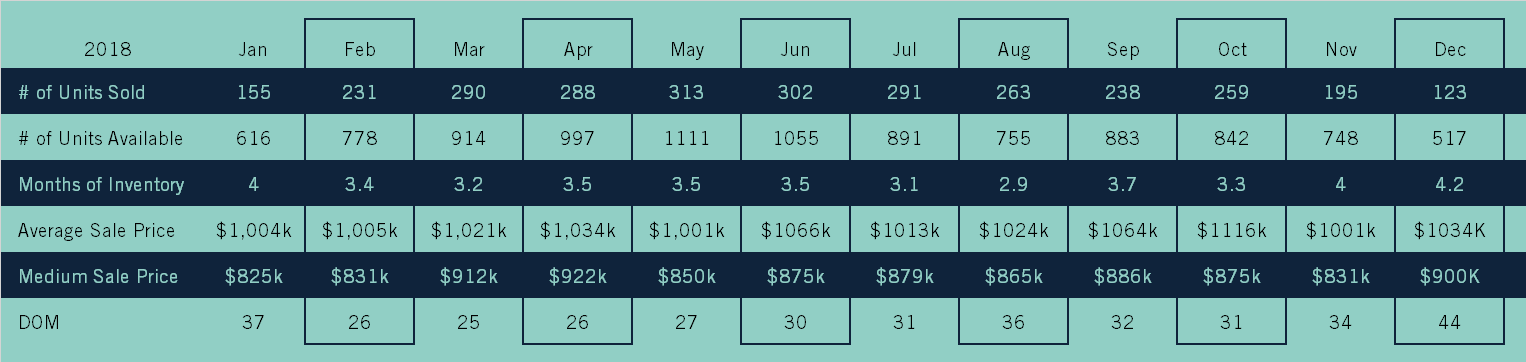
2018
2017

The above charts show summaries of activities in the Oakville market compared monthly by year.
Months of inventory (MOI): this value is an indication of how long it would take to sell all the current inventory if nothing new came to the market.
Days on market (DOM): this is the average number of days that a property takes to sell.
For more detailed information on your property and neighbourhood, please contact me